Sevastopol': region in Ukraine
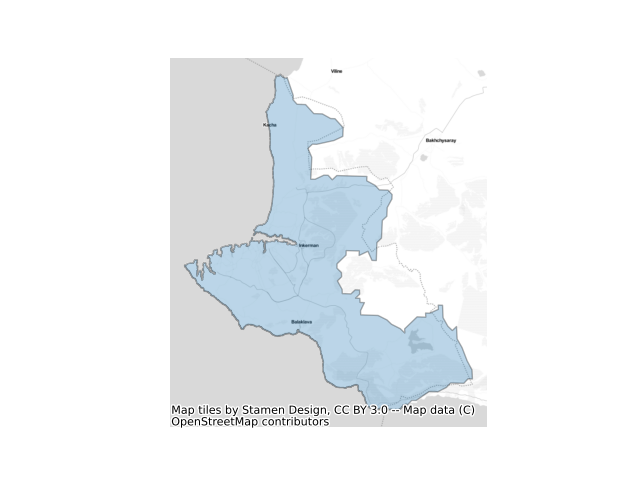
What exactly constitutes the spatial extent of the city? For these aggregations, we used the Global Human Settlement Layer Urban Center Database (GHS-UCDB) to define the boundaries of the city. These cities -- or urban centers -- cover areas that are densely populated and built-up, and so may extend beyond the spatial borders of these cities that we may be familiar with. The GHS area is shaded in blue.
View Sevastopol', Ukraine on the sprawlmap
Most recent snapshot: Taking into account the entire (i.e. aggregate) street network in Sevastopol' as of 2014, the overall level of street-network sprawl is 2.83, which is in the 40th to 60th percentile of disconnectedness.
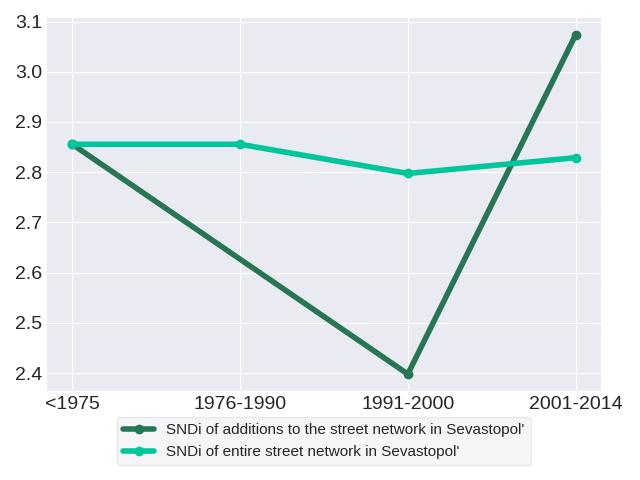
Trends in street network construction: The SNDis of street construction for the respective time periods are 2.86, nan, 2.4 and 3.07. Data was not available in 1976-1990.
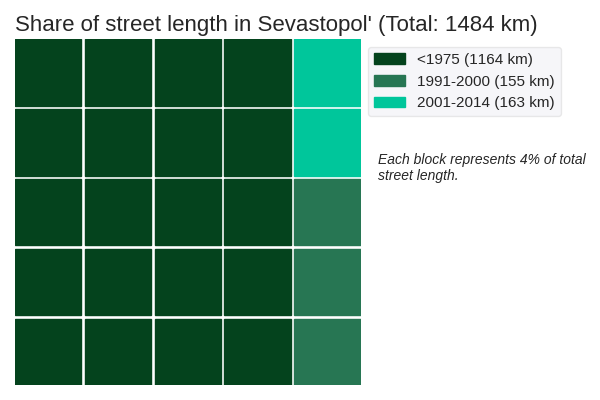
Quantity of street network construction: The street network in Sevastopol' spans a total of 1484 kilometers. It is dominated by roads constructed prior to 1975. These roads have an SNDi of 2.86, which is in the 40th to 60th percentile of disconnectedness.
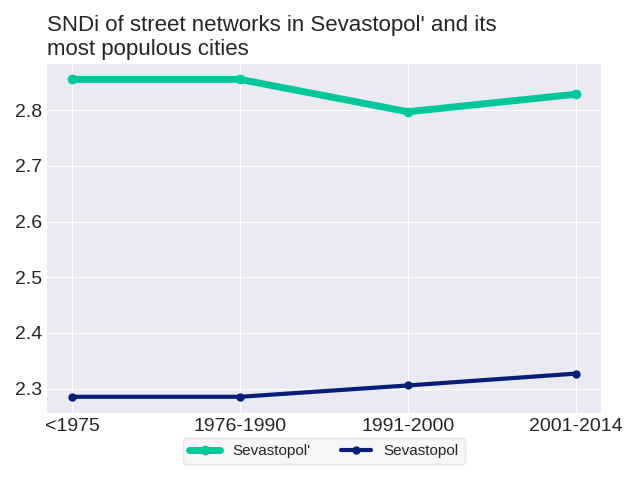
Effect on the aggregate network: New construction in each period adds to the total stock of streets, but does not change streets that have already been built. Therefore, it has a limited effect on the street network as a whole. The SNDis of the aggregate street network in the respective time periods are 2.86, 2.86, 2.8 and 2.83. Disconnectivity in Sevastopol''s street network follows a zig-zag trend. In 1991-2000, the region was most disconnected; while it was most connected in 1975.
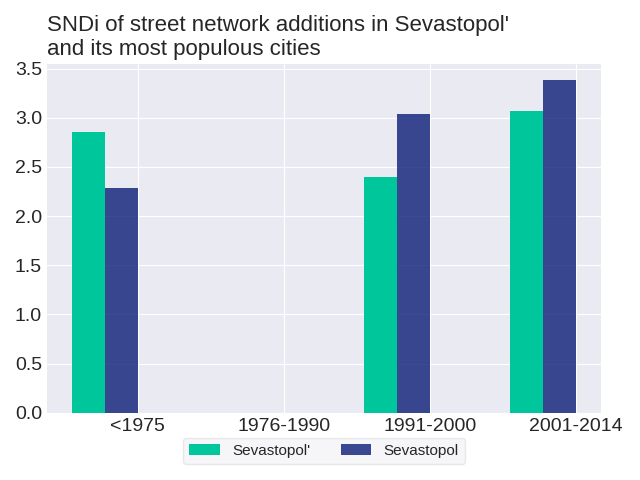
The level of street-network sprawl in new development in Sevastopol' followed a zig-zag trend with an overall increase. To get a sense of how street development has changed in Sevastopol', we can consider one of its most populous cities: Sevastopol. None of the most populous cities follow the same trend as the region. The level of street-network sprawl in new development in Sevastopol followed a zig-zag trend with an overall increase.
How do development practices in Sevastopol' fare in comparison to others in Ukraine? Most recently in 2001-2014, street construction in Sevastopol' was the 27th-most disconnected out of the 27 regions in Ukraine. Its position in the ranks since 1975 has fallen; relative to other regions in Ukraine, street construction in Sevastopol' has become more connected. Sevastopol' ranked 15th in 1975, 26th in 1991-2000 and 27th in 2001-2014. There was no ranking in 1976-1990 due to unavailable data.
As of 2014, the city with the most disconnected street network in Sevastopol' is Sevastopol with an SNDi of 2.33, which is in the 40th to 60th percentile of disconnectedness. Conversely, the most connected city is Sevastopol with an SNDi of 2.33, which is in the 40th to 60th percentile of disconnectedness. See trends for these cities: Sevastopol, Sevastopol
The level of street-network sprawl in the aggregate network in Sevastopol' followed a zig-zag trend with an overall decrease. To get a sense of how the aggregate street network has changed in Sevastopol', we can consider one of its most populous cities: Sevastopol. None of the most populous cities follow the same trend as the region. The level of street-network sprawl in the aggregate network in Sevastopol rose steadily.
To date, Sevastopol' is the 19th-most disconnected out of the 27 regions in Ukraine. Its position in the ranks since 1975 has fallen; relative to other regions in Ukraine, the street network in Sevastopol' has become more connected. Sevastopol' ranked 15th in 1975, 17th in 1976-1990, 19th in 1991-2000 and 19th in 2001-2014.