Chowol-eup: city in Gyeonggi-do, South Korea


What exactly constitutes the spatial extent of the city? For these aggregations, we used the Global Human Settlement Layer Urban Center Database (GHS-UCDB) to define the boundaries of the city. These cities -- or urban centers -- cover areas that are densely populated and built-up, and so may extend beyond the spatial borders of these cities that we may be familiar with. The GHS area is shaded in blue.
View Chowol-eup, South Korea on the sprawlmap

Most recent snapshot: Taking into account the entire (i.e. aggregate) street network in Chowol-eup as of 2014, the overall level of street-network sprawl is 1.83, which is relatively well-connected.
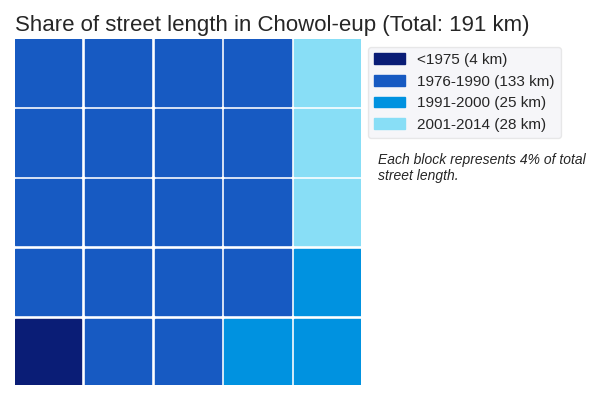
Trends in street network construction: The SNDis of street construction for the respective time periods are 1.23, 1.62, 3.11 and 1.92. Street construction in Chowol-eup increased in disconnectivity initially but has since improved. The streets constructed in 1991-2000 were the most disconnected.
Quantity of street network construction: The street network in Chowol-eup spans a total of 191 kilometers. It is dominated by roads constructed in 1976-1990. These roads have an SNDi of 1.62, which is relatively well-connected.
Effect on the aggregate network: New construction in each period adds to the total stock of streets, but does not change streets that have already been built. Therefore, it has a limited effect on the street network as a whole. The SNDis of the aggregate street network in the respective time periods are 1.23, 1.59, 1.82 and 1.83. Overall, the SNDi of the aggregate street network has risen: the street network in Chowol-eup has become more disconnected. This increase has slowed: between 1975 and 1976-1990, SNDi rose by 0.37 points, but between 1991-2000 and 2001-2014, it rose by just 0.01.
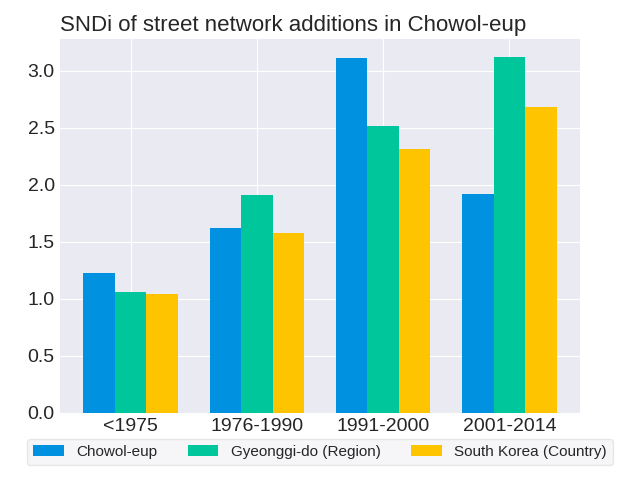
Chowol-eup and Gyeonggi-do do not follow the same trend in the disconnectivity of their street network constructions. The SNDi in Chowol-eup peaked in 1991-2000, while the SNDi of street constructions in Gyeonggi-do rose steadily.
How do development practices in Chowol-eup fare in comparison to others in Gyeonggi-do? Most recently in 2001-2014, street construction in Chowol-eup was the 4th-most disconnected out of the 5 cities in Gyeonggi-do. Its position in the ranks since 1975 has fallen; relative to other cities in Gyeonggi-do, street construction in Chowol-eup has become more connected. Chowol-eup ranked 2nd in 1975, 5th in 1976-1990, 2nd in 1991-2000 and 4th in 2001-2014.
Chowol-eup and South Korea do not follow the same trend in the disconnectivity of their street network constructions. The SNDi in Chowol-eup peaked in 1991-2000, while the SNDi of street constructions in South Korea rose steadily.
How do development practices in Chowol-eup fare in comparison to others in South Korea? Most recently in 2001-2014, street construction in Chowol-eup was the 24th-most disconnected out of the 39 cities in South Korea. Its position in the ranks since 1975 has fallen; relative to other cities in South Korea, street construction in Chowol-eup has become more connected. Chowol-eup ranked 7th in 1975, 12th in 1976-1990, 6th in 1991-2000 and 24th in 2001-2014.

Chowol-eup and Gyeonggi-do follow the same trend in the disconnectivity of their aggregate street networks. The SNDi for both of these rose steadily.
To date, Chowol-eup is the 3rd-most disconnected out of the 5 cities in Gyeonggi-do. Its position in the ranks since 1975 has fallen; relative to other cities in Gyeonggi-do, the street network in Chowol-eup has become more connected. Chowol-eup ranked 2nd in 1975, 3rd in 1976-1990, 3rd in 1991-2000 and 3rd in 2001-2014.
Chowol-eup and South Korea follow the same trend in the disconnectivity of their aggregate street networks. The SNDi for both of these rose steadily.
To date, Chowol-eup is the 5th-most disconnected out of the 39 cities in South Korea. Its position in the ranks since 1975 has risen; relative to other cities in South Korea, the street network in Chowol-eup has become more disconnected. Chowol-eup ranked 7th in 1975, 5th in 1976-1990, 5th in 1991-2000 and 5th in 2001-2014.
As of 2015, Chowol-eup had a built-up area of 11.74 square kilometers, and a population of 75010 people.
These are some other cities with approximately the same population: