Noord-Brabant: region in Netherlands
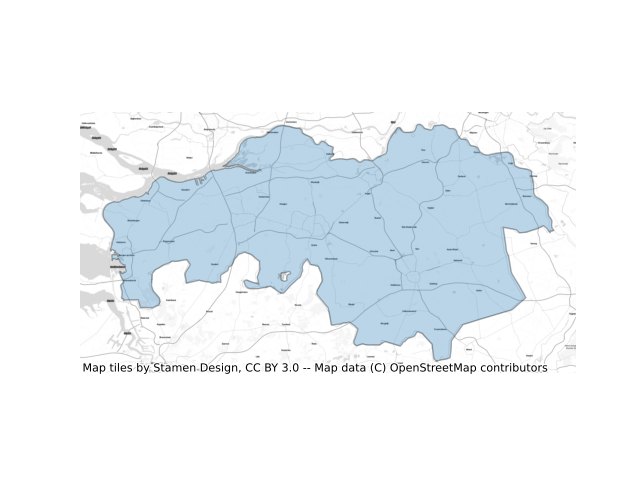
What exactly constitutes the spatial extent of the city? For these aggregations, we used the Global Human Settlement Layer Urban Center Database (GHS-UCDB) to define the boundaries of the city. These cities -- or urban centers -- cover areas that are densely populated and built-up, and so may extend beyond the spatial borders of these cities that we may be familiar with. The GHS area is shaded in blue.
View Noord-Brabant, Netherlands on the sprawlmap
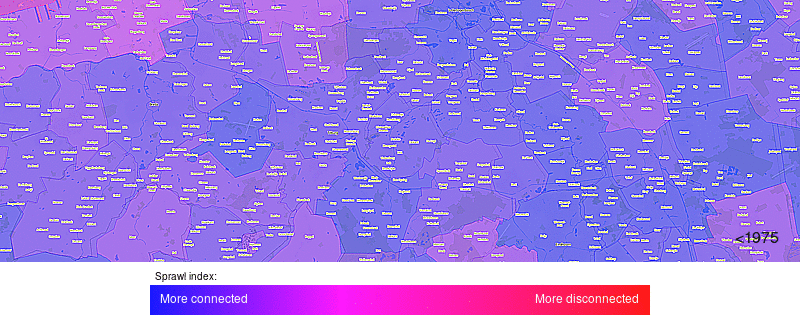
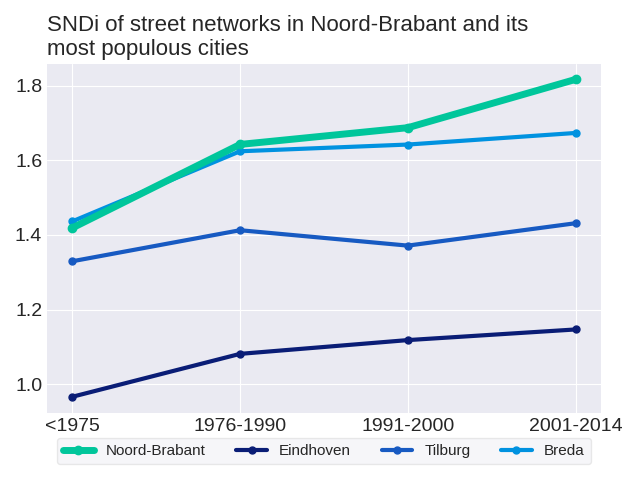
Most recent snapshot: Taking into account the entire (i.e. aggregate) street network in Noord-Brabant as of 2014, the overall level of street-network sprawl is 1.82, which is relatively well-connected.
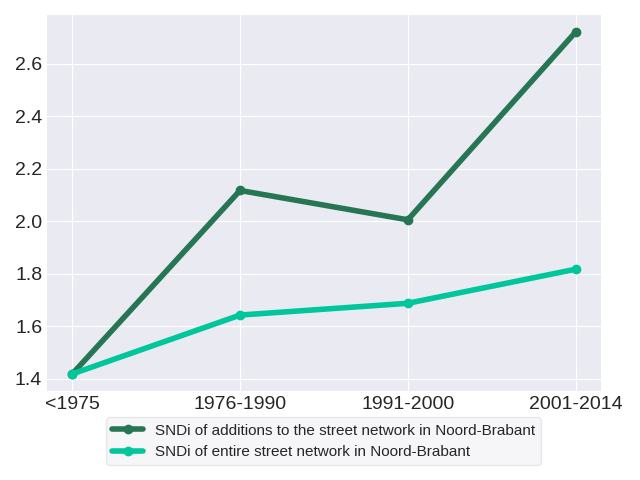
Trends in street network construction: The SNDis of street construction for the respective time periods are 1.42, 2.12, 2.01 and 2.72. Disconnectivity in street construction in Noord-Brabant follows a zig-zag trend. In 1975, street construction was most disconnected, while construction was most connected in 2001-2014.
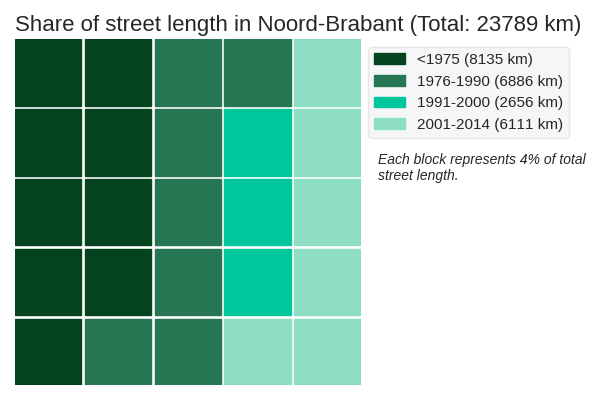
Quantity of street network construction: The street network in Noord-Brabant spans a total of 23789 kilometers. The period with the greatest volume of street construction was 1975. These roads have an SNDi of 1.42, which is relatively well-connected.
Effect on the aggregate network: New construction in each period adds to the total stock of streets, but does not change streets that have already been built. Therefore, it has a limited effect on the street network as a whole. The SNDis of the aggregate street network in the respective time periods are 1.42, 1.64, 1.69 and 1.82. Overall, the SNDi of the aggregate street network has risen: the street network in Noord-Brabant has become more disconnected. This increase has slowed: between 1975 and 1976-1990, SNDi rose by 0.22 points, but between 1991-2000 and 2001-2014, it rose by just 0.13.
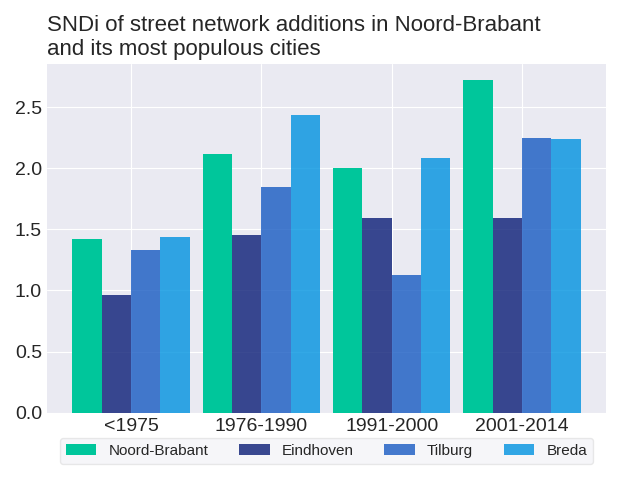
The level of street-network sprawl in new development in Noord-Brabant followed a zig-zag trend with an overall increase. To get a sense of how street development has changed in Noord-Brabant, we can consider three of its most populous cities: Eindhoven, Tilburg and Breda. Out of the three cities, Eindhoven does not follow the same trend as the region. The level of street-network sprawl in new development in Eindhoven peaked in 1991-2000.
How do development practices in Noord-Brabant fare in comparison to others in Netherlands? Most recently in 2001-2014, street construction in Noord-Brabant was the 4th-most disconnected out of the 10 regions in Netherlands. Its position in the ranks since 1975 has risen; relative to other regions in Netherlands, street construction in Noord-Brabant has become more disconnected. Noord-Brabant ranked 8th in 1975, 8th in 1976-1990, 9th in 1991-2000 and 4th in 2001-2014.
As of 2014, the city with the most disconnected street network in Noord-Brabant is Roosendaal with an SNDi of 2.05, which is relatively well-connected. Conversely, the most connected city is 's-Hertogenbosch with an SNDi of 1.03, which is relatively well-connected. See trends for these cities: 's-Hertogenbosch, Roosendaal
The level of street-network sprawl in the aggregate network in Noord-Brabant rose steadily. To get a sense of how the aggregate street network has changed in Noord-Brabant, we can consider three of its most populous cities: Eindhoven, Tilburg and Breda. Out of the three cities, Tilburg does not follow the same trend as the region. The level of street-network sprawl in the aggregate network in Tilburg followed a zig-zag trend with an overall increase.
To date, Noord-Brabant is the 5th-most disconnected out of the 10 regions in Netherlands. Its position in the ranks since 1975 has risen; relative to other regions in Netherlands, the street network in Noord-Brabant has become more disconnected. Noord-Brabant ranked 8th in 1975, 8th in 1976-1990, 8th in 1991-2000 and 5th in 2001-2014.