San Pedro de Macorís: city in Dominican Republic
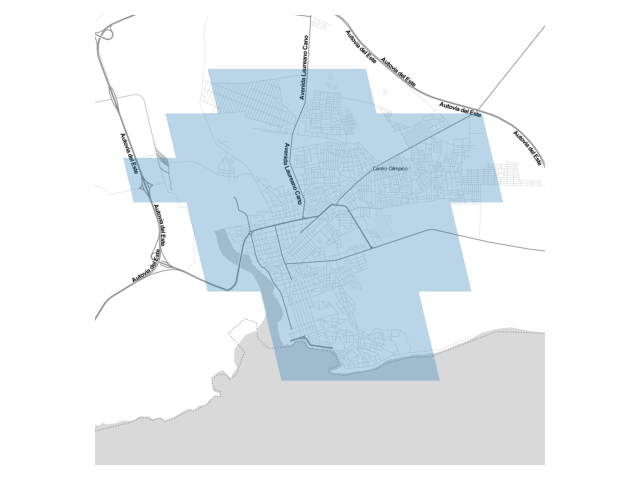
What exactly constitutes the spatial extent of the city? For these aggregations, we used the Global Human Settlement Layer Urban Center Database (GHS-UCDB) to define the boundaries of the city. These cities -- or urban centers -- cover areas that are densely populated and built-up, and so may extend beyond the spatial borders of these cities that we may be familiar with. The GHS area is shaded in blue.
View San Pedro de Macorís, Dominican Republic on the sprawlmap
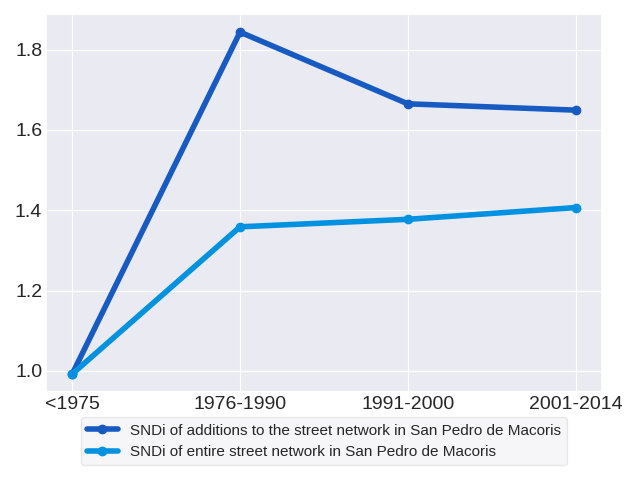
Most recent snapshot: Taking into account the entire (i.e. aggregate) street network in San Pedro de Macorís as of 2014, the overall level of street-network sprawl is 1.41, which is relatively well-connected.
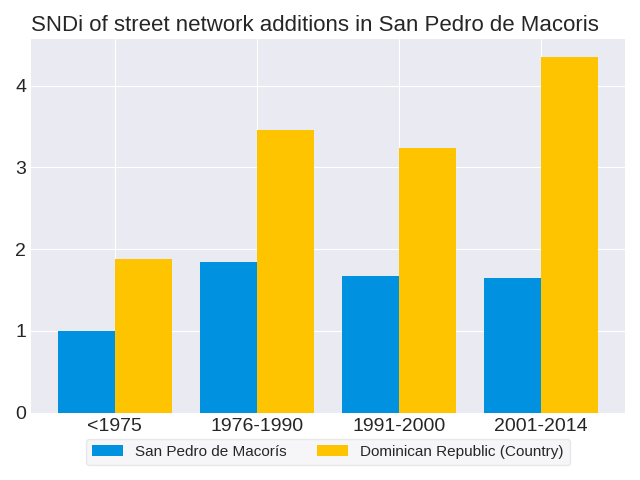
Trends in street network construction: The SNDis of street construction for the respective time periods are 0.99, 1.84, 1.67 and 1.65. Street construction in San Pedro de Macorís increased in disconnectivity initially but has since improved. The streets constructed in 1976-1990 were the most disconnected.
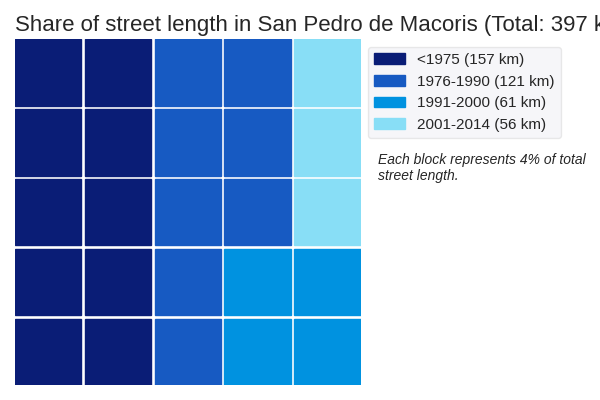
Quantity of street network construction: The street network in San Pedro de Macorís spans a total of 397 kilometers. The period with the greatest volume of street construction was 1975. These roads have an SNDi of 0.99, which is relatively well-connected.
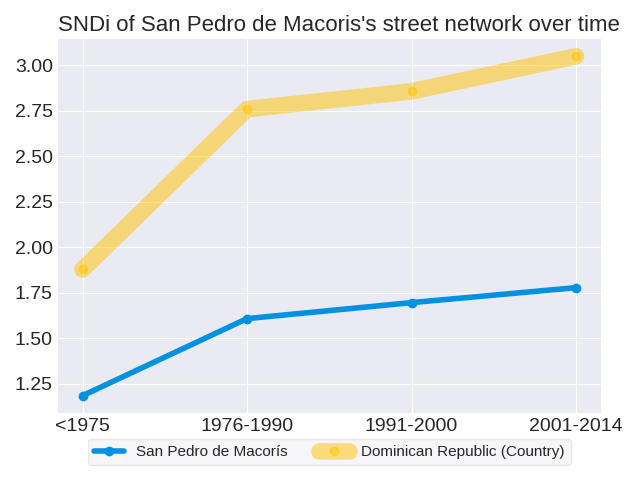
Effect on the aggregate network: New construction in each period adds to the total stock of streets, but does not change streets that have already been built. Therefore, it has a limited effect on the street network as a whole. The SNDis of the aggregate street network in the respective time periods are 0.99, 1.36, 1.38 and 1.41. Overall, the SNDi of the aggregate street network has risen: the street network in San Pedro de Macorís has become more disconnected. This increase has slowed: between 1975 and 1976-1990, SNDi rose by 0.37 points, but between 1991-2000 and 2001-2014, it rose by just 0.03.
San Pedro de Macorís and San Pedro de Macorís do not follow the same trend in the disconnectivity of their street network constructions. The SNDi in San Pedro de Macorís peaked in 1976-1990, while the SNDi of street constructions in San Pedro de Macorís peaked in 1991-2000.
How do development practices in San Pedro de Macorís fare in comparison to others in San Pedro de Macorís? Most recently in 2001-2014, street construction in San Pedro de Macorís was the 1st-most disconnected out of the 1 cities in San Pedro de Macorís. Its position in the ranks since 1975 has not changed. San Pedro de Macorís ranked 1st in 1975, 1st in 1976-1990, 1st in 1991-2000 and 1st in 2001-2014.
San Pedro de Macorís and Dominican Republic do not follow the same trend in the disconnectivity of their street network constructions. The SNDi in San Pedro de Macorís peaked in 1976-1990, while the SNDi of street constructions in Dominican Republic followed a zig-zag trend with an overall increase.
How do development practices in San Pedro de Macorís fare in comparison to others in Dominican Republic? Most recently in 2001-2014, street construction in San Pedro de Macorís was the 11th-most disconnected out of the 16 cities in Dominican Republic. Its position in the ranks since 1975 has fallen; relative to other cities in Dominican Republic, street construction in San Pedro de Macorís has become more connected. San Pedro de Macorís ranked 7th in 1975, 9th in 1976-1990, 10th in 1991-2000 and 11th in 2001-2014.
San Pedro de Macorís and San Pedro de Macorís follow the same trend in the disconnectivity of their aggregate street networks. The SNDi for both of these rose steadily.
To date, San Pedro de Macorís is the 1st-most disconnected out of the 1 cities in San Pedro de Macorís. Its position in the ranks since 1975 has not changed. San Pedro de Macorís ranked 1st in 1975, 1st in 1976-1990, 1st in 1991-2000 and 1st in 2001-2014.
San Pedro de Macorís and Dominican Republic follow the same trend in the disconnectivity of their aggregate street networks. The SNDi for both of these rose steadily.
To date, San Pedro de Macorís is the 8th-most disconnected out of the 16 cities in Dominican Republic. Its position in the ranks since 1975 has fallen; relative to other cities in Dominican Republic, the street network in San Pedro de Macorís has become more connected. San Pedro de Macorís ranked 7th in 1975, 8th in 1976-1990, 8th in 1991-2000 and 8th in 2001-2014.
As of 2015, San Pedro de Macorís had a built-up area of 16.11 square kilometers, and a population of 213965 people.
These are some other cities with approximately the same population: